ISSUES: GLOBAL WARMING
LITTLE TIME TO AVOID BIG THAW, SCIENTISTS WARN
Arctic temperatures near a prehistoric level when seas were 16 to 20 feet higher, studies say.
By Peter N. Spotts Staff writer of The Christian Science Monitor
Global warming appears to be pushing vast reservoirs of ice on Greenland and Antarctica toward a significant, long-term meltdown. The world may have as little as a decade to take the steps to avoid this scenario.
Those are the implications of new studies that looked to climate history for clues about how the planet's major ice sheets might respond to human-triggered climate change.
Already, temperatures in the Arctic are close to those that thawed much of Greenland's ice cap some 130,000 years ago, when the planet last enjoyed a balmy respite from continent-covering glaciers, say the studies' authors.
By 2100, spring and summer temperatures in the Arctic could reach levels that trigger an unstoppable repeat performance, they say. Over several centuries, the melt could raise sea levels by as much as 20 feet, submerging major cities worldwide as well as chains of islands, such as the present-day Bahamas.
The US would lose the lower quarter of Florida, southern Louisiana up to Baton Rouge, and North Carolina's Outer Banks. The ocean would even flood a significant patch of California's Central Valley, lapping at the front porches of Sacramento.
These estimates may understate the potential rise. The teams say their studies provide the first hints that during the last interglacial period, ice sheets in both hemispheres worked together to raise sea levels, rather than the Northern Hemisphere's ice alone. This raises concerns that Antarctic melting might be more severe this time, because additional melt mechanisms may be at work.
"It sounds bad," acknowledges Jonathan Overpeck, a University of Arizona researcher who led one of the two studies. He notes that rising temperatures are approaching a threshold. But "we know about it far enough in advance to avoid crossing it." The challenge, he and others say, is to take advantage of the remaining window by reducing emissions of greenhouse gases substantially.
The two studies were published in Friday's issue of the journal Science.
Ice on Greenland and Antarctica is already thinning faster than it's being replaced - and faster than scientists thought it would, notes Richard Alley, a paleoclimatologist at Penn State University and member of one of the research teams. Only five years ago, he notes, climate scientists expected the ice sheets to gain mass through 2100, then begin to melt. "We're now 100 years ahead of schedule," he says.
The new results aren't the end of the story. The researchers will refine the models, improve the measurements, and find other sources of data to verify the modeling. Coral data pointing to sea-level changes in the last warm period remain controversial, the team acknowledges. And the team's assumption that the amount of carbon dioxide would triple by 2100, although moderate among climate forecasts, is not a done deal. It depends on how quickly industrial and developing countries adopt low-emission technologies and take long-term steps to reduce greenhouse gases.
But the window for action is relatively short, Dr. Overpeck says. CO2 remains in the atmosphere for more than a century after it's first emitted. And it takes time to implement policies and adopt technologies. Thus for all practical purposes, the tipping point may come sooner than atmospheric chemistry would suggest.
The studies required some in-depth sleuthing. Researchers realized that changes in Earth's tilt and orbit intensified the sunlight reaching the Arctic during interglacial periods, notes Bette Otto- Bliesner, a scientist at the National Center for Atmospheric Research in Boulder, Colo. But when it came to the effect on the Arctic's ice, "no one knew how big the response would be."
So she and her colleagues first tested the center's newest climate model against temperature information gleaned from pollen, insects, ocean plankton, and other remnants of the period. The results matched closely.
Confident that they could reproduce the period's climate by computer, they linked the results to a second model with a reputation for accurately simulating ice sheets. Using ice-core samples and other evidence as a reality check, they concluded that within 1,000 to 2,000 years of the warming's onset, Greenland's ice sheet dwindled to a steep lump covering the island's central and northern parts. The melt water raised sea levels by seven to 11 feet.
But coral records from geologically stable parts of the ocean suggested that sea levels during that time rose 16 to 20 feet - a level that held for roughly 11,000 years. Overpeck, who had been working with Dr. Otto-Bliesner on the initial modeling exercise, says several lines of evidence led him to suspect that the balance came from Antarctica.
From there, the team used the climate model to estimate the warming that could occur by 2130 if CO2 emissions rose by 1 percent per year. In the pantheon of emissions scenarios, this represents a moderate one, he holds. But it's enough to triple CO2 concentrations by 2100, leading to summers that are 5 to 8 degrees F. warmer than today - levels that appear to have melted the ice 129,000 years ago.
http://www.csmonitor.com/2006/0324/p01s03-sten.htmlGlobal Warming Puts the Arctic on Thin Ice
1
. Why are global warming specialists watching the Arctic so closely?
The Arctic is global warming's canary in the coal mine. It's a highly sensitive region, and it's being profoundly affected by the changing climate. Most scientists view what's happening now in the Arctic as a harbinger of things to come.
Since 1979, the size of the summer polar ice cap has shrunk more than 20 percent. (Illustration from NASA)
2. What kinds of changes are taking place in the Arctic now?
Average temperatures in the Arctic region are rising twice as fast as they are elsewhere in the world. Arctic ice is getting thinner, melting and rupturing. For example, the largest single block of ice in the Arctic, the Ward Hunt Ice Shelf, had been around for 3,000 years before it started cracking in 2000. Within two years it had split all the way through and is now breaking into pieces.
The polar ice cap as a whole is shrinking. Images from NASA satellites show that the area of permanent ice cover is contracting at a rate of 9 percent each decade. If this trend continues, summers in the Arctic could become ice-free by the end of the century.
3
. How does this dramatic ice melt affect the Arctic?
The melting of once-permanent ice is already affecting native people, wildlife and plants. When the Ward Hunt Ice Shelf splintered, the rare freshwater lake it enclosed, along with its unique ecosystem, drained into the ocean. Polar bears, whales, walrus and seals are changing their feeding and migration patterns, making it harder for native people to hunt them. And along Arctic coastlines, entire villages will be uprooted because they're in danger of being swamped. The native people of the Arctic view global warming as a threat to their cultural identity and their very survival.
4. Will Arctic ice melt have any effects beyond the polar region?
Yes -- the contraction of the Arctic ice cap is accelerating global warming. Snow and ice usually form a protective, cooling layer over the Arctic. When that covering melts, the earth absorbs more sunlight and gets hotter. And the latest scientific data confirm the far-reaching effects of climbing global temperatures.
Rising temperatures are already affecting Alaska, where the spruce bark beetle is breeding faster in the warmer weather. These pests now sneak in an extra generation each year. From 1993 to 2003, they chewed up 3.4 million acres of Alaskan forest.
Melting glaciers and land-based ice sheets also contribute to rising sea levels, threatening low-lying areas around the globe with beach erosion, coastal flooding, and contamination of freshwater supplies. (Sea level is not affected when floating sea ice melts.) At particular risk are island nations like the Maldives; over half of that nation's populated islands lie less than 6 feet above sea level. Even major cities like Shanghai and Lagos would face similar problems, as they also lie just six feet above present water levels.
Rising seas would severely impact the United States as well. Scientists project as much as a 3-foot sea-level rise by 2100. According to a 2001 U.S. Environmental Protection Agency study, this increase would inundate some 22,400 square miles of land along the Atlantic and Gulf coasts of the United States, primarily in Louisiana, Texas, Florida and North Carolina.
A warmer Arctic will also affect weather patterns and thus food production around the world. Wheat farming in Kansas, for example, would be profoundly affected by the loss of ice cover in the Arctic. According to a NASA Goddard Institute of Space Studies computer model, Kansas would be 4 degrees warmer in the winter without Arctic ice, which normally creates cold air masses that frequently slide southward into the United States. Warmer winters are bad news for wheat farmers, who need freezing temperatures to grow winter wheat. And in summer, warmer days would rob Kansas soil of 10 percent of its moisture, drying out valuable cropland.
5. Can we do anything to stop global warming?
Yes. When we burn fossil fuels -- oil, coal and gas -- to generate electricity and power our vehicles, we produce the heat-trapping gases that cause global warming. The more we burn, the faster churns the engine of global climate change. Thus the most important thing we can do is save energy.
And we can do it. Technologies exist today to make cars that run cleaner and burn less gas, generate electricity from wind and sun, modernize power plants, and build refrigerators, air conditioners and whole buildings that use less power. As individuals, each of us can
take steps to save energy and fight global warming.
Resource from:
http://www.nrdc.org/globalwarming/qthinice.asp


 Title - The Ice Caps Must Remain in the Arctic- The Big Thaw Must Not Happen

 After
After 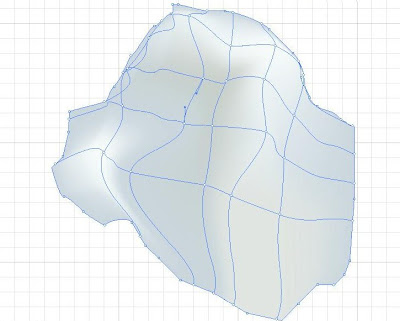
 After
After 
 After
After 
 After
After 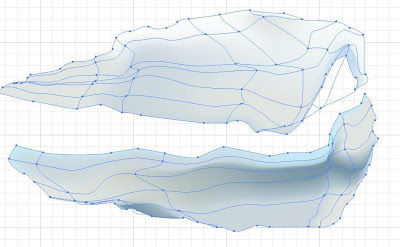
 After
After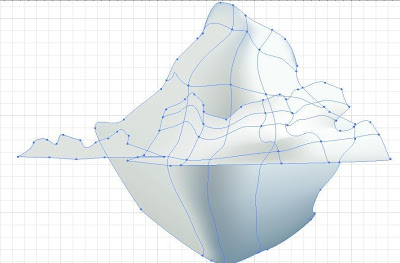


 After-


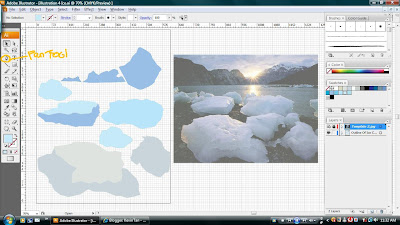
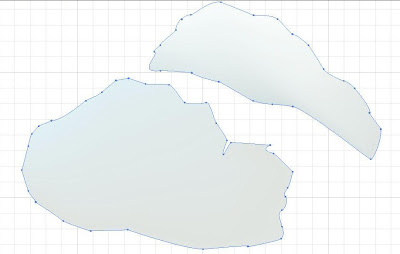
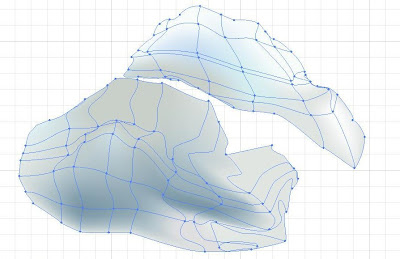
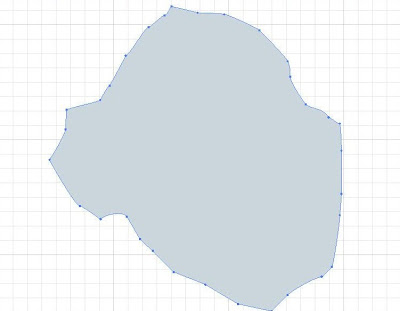
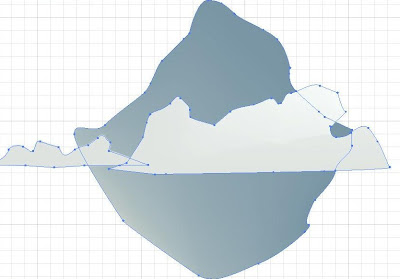
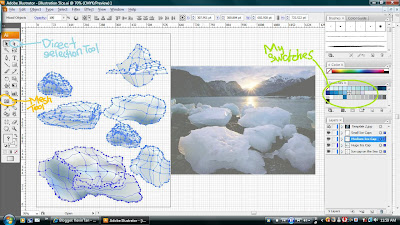
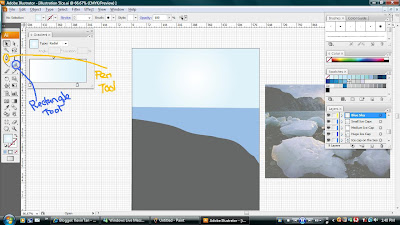
 This is the complete view of my illustration for Assignment 2. I will post my explanation about the melting of Ice-Caps and about this illustration on the next blog.


